fbpx skip to Main Content

Fourth Quarter 2019 Business and Economic Indicators

Report provided by

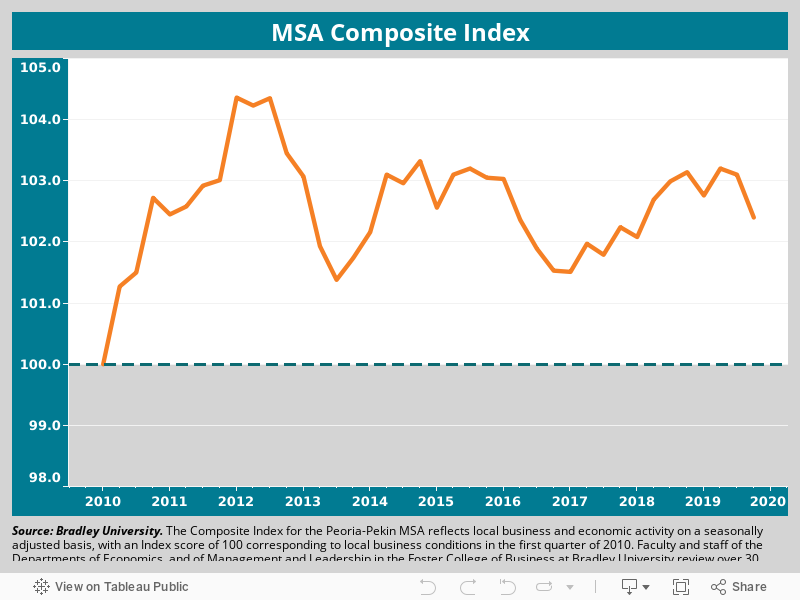
The Composite Index of Business and Economic Indicators of the Peoria-Pekin Metropolitan Statistical Area (MSA; Peoria, Tazewell, Woodford, Stark and Marshall counties) for the third quarter was computed at 103.1, similar to the previous quarter and year earlier levels (See chart, above). The third quarter Index level controls for normal seasonal growth trends among the key seasonally adjusted labor market, job market and local sales indicators studied.

A detailed analysis of these data appears below. Data reported are adjusted for normal seasonal variation, unless specified otherwise.

Labor and Job Markets

The number of jobs on area employer payrolls fell 1.1% from the year before. The declines in jobs had little impact on the number of area residents who were working, a figure that remained little changed from one year earlier. It should be noted that the number of working area residents includes those on employer payrolls, and those classified as self-employed.

The declines in jobs on area employer payrolls also had little impact on local unemployment rates: Rather, the fourth quarter local unemployment rate declined, with its rate of 4.4% 0.8 percentage points below the 5.2% rate of the year before.

Industry Performance

Jobs on the payrolls of six private industries are monitored for this study. The number of jobs in the area’s largest industry, Education and Health Services (dominated by Health Services employment) rose from the year before. Employment in Construction was unchanged from the year before.

Declines were found for jobs in four of the six private industries monitored for this study, with reduced payrolls in Manufacturing, Professional and Business Services, Hospitality/Entertainment and Retail and Wholesale trade. The declines in these jobs are consistent with the increased local layoffs in the fourth quarter, indicated by increases in the local Unemployment Claims Index to 70.1, up 21.1% from the previous quarter, and putting the Index 13.7% higher than the year before.

Local sales and related services

Fourth quarter estimated retail sales were up 1.6% from the year before, similar to the inflation recorded by the Consumer Price Index (CPI) for the same period. Reduced numbers were buying homes, with the number of homes sold down 10.9% from the year before, and fewer homes available for sale, with the data showing 17.9% fewer homes available for sale than last year.

Area builders increased their new Single Family Building Permits by 15.0% from the year before. The fourth quarter Single Family Building Permits Index score of 56.5 still remained below the 100 of the base year of 2010.

Review and Outlook

Looking ahead, the local “leading indicators” (that signal future levels of economic performance) are mixed, pointing to little overall growth for area employers in the short term.

Longer term area business and economic growth trends are expected to result from regional capital investment projects; the retirements of members of the large post-World War II “baby boom” cohort replaced by local job seekers (see Reinhold, 2018 for research on retirement and Illinois labor force); and from increases in the numbers of the self-employed and entrepreneurs among area residents.

Bernard Goitein, PhD
Professor of Management and Leadership
Foster College of Business

Joshua Lewer, PhD
Professor of Management and Leadership
Foster College of Business

Matthew Nordin
Research Assistant
Foster College of Business

© Bradley University

Reinhold, Rich, “Declining Labor Force Participation in Illinois:Why Have More People Stopped Working or Looking for Work” Illinois Department of Employment Security | Economic Information and Analysis Division | January 2018 http://www.ides.illinois.gov/lmi/ILMR/DecliningLaborForce.pdf

Background

Business indicator data reported are adjusted for normal seasonal variation, except where indicated otherwise. We rely on SPSS for seasonal adjustment.The seasonal adjustment procedure removes the impact of seasonal components, i.e., the predictable seasonal variations of the data, so that any underlying trend in the data series can be discerned.

The “Composite Peoria-Pekin MSA Index” consists of the average of 14 key standardized, seasonally adjusted economic indicators. Indicators are standardized using a z transformation. A value of 100 corresponds to the Index value in the first quarter of 2010.

The “Single Family Building Permits” Index includes activity authorized by local building permits issued by the City of Peoria, Peoria County, Tazewell County and Woodford County.

The “Job Opening Index” reflects an a weighted average of new help wanted postings for the Peoria MSA, with an Index value of 100 corresponding to the average quarter’s five-county help wanted postings in 2012.

The “New Unemployment Claims Index” refers to the seasonally adjusted number of new weekly unemployment claims in the five-county Peoria-Pekin MSA, with an Index value of 100 reflecting the average weekly number of new unemployment claims in 2010.

A regression model is used to estimate the most recent quarter’s taxable retail sales.The Inflation Adjusted Retail Sales Index reflects estimated taxable retail spending in the Peoria-Pekin MSA, adjusted for inflation and for normal seasonal variation in retail sales. A score of 100 represents the inflation adjusted, seasonally adjusted retail sales during the first quarter of 2010.

The five-county seasonally adjusted Index of available homes for sale is computed relative to the score of 100 in the base year of 2010.The estimate of the seasonally adjusted Index of Price of Homes Sold is computed relative to a score of 100 in the base year of 2010.

US government statistics compiled with seasonal adjustment include Illinois and US unemployment rates, the average number of hours worked/week by production and non-supervisory workers, average number of hours of overtime worked/week in durable goods manufacturing, the Midwest Urban Consumer Price Index (CPI; computed monthly for the Midwest region by the Bureau of Labor Statistics), the Midwest quit rate, Value of U.S. Dollar Index,” and the Gross Domestic Product.

The Quit Rate is the number of quits during the month, divided by the number of employees who worked at that time.

Download a PDF of this report.

Back To Top