Wage and COLI data
While wages fluctuate depending on the season, the cost of living is often dependent on long term factors that change irregularly. The second chart shows wages compared across Greater Peoria counties, while the first chart displays the cost of living in the Peoria MSA versus other comparable cities.

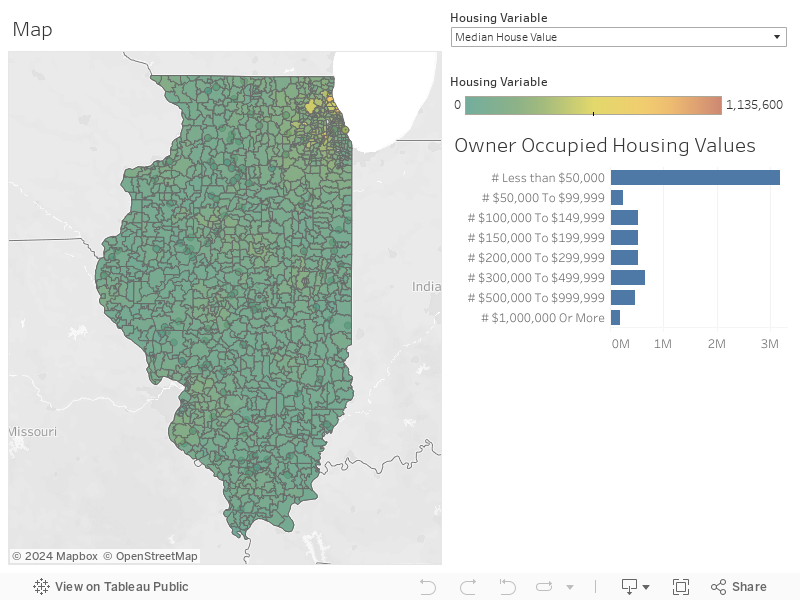
Housing Data
The map can be adjusted to display the vacancy rates or median housing values across ZIP codes in Illinois. Click on a ZIP code to see further breakdown of housing values in the bar chart on the right. (American Community Survey, 2011-2015).
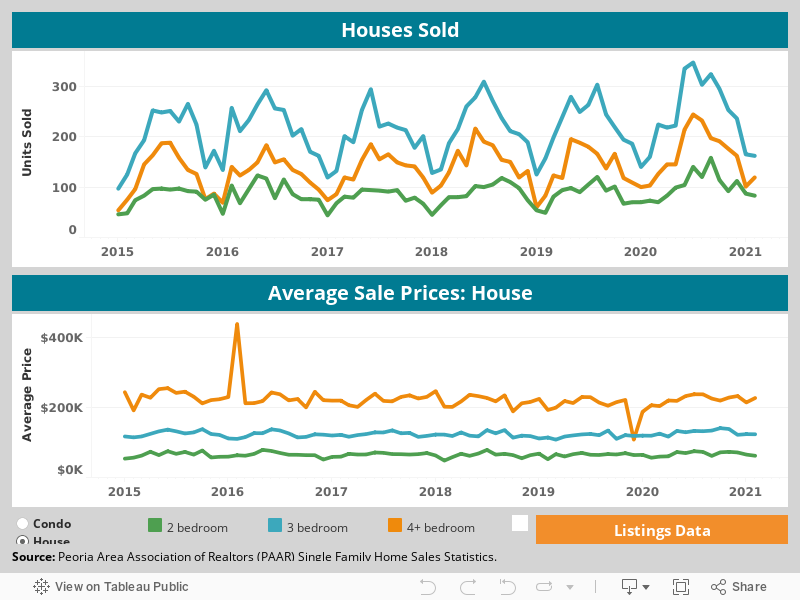
Real Estate Data
Trends in real estate, including listings, sales, and costs, can be barometers for the health of a region. Below are statistics on real estate sales and listings in the Peoria MSA for Single Family Homes and Condos. Select condo or house to change your view. (Source: Peoria Area Association of Realtors)
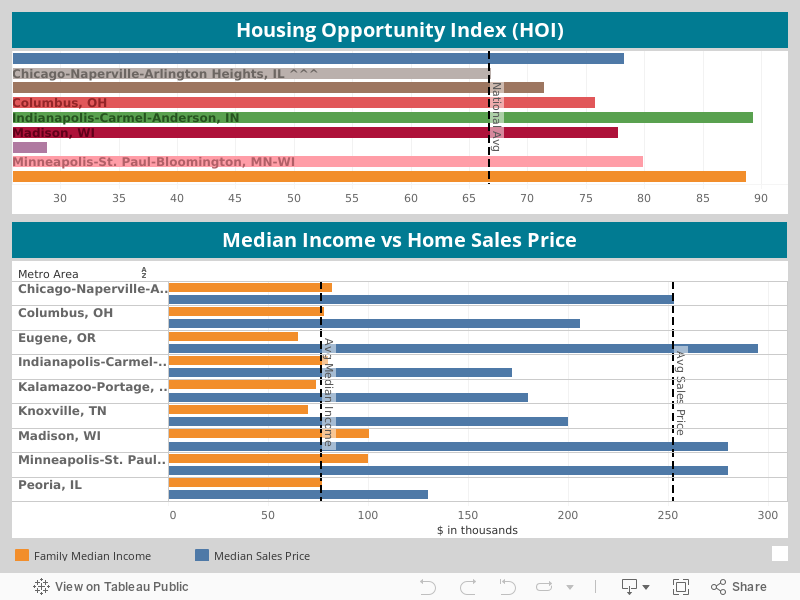
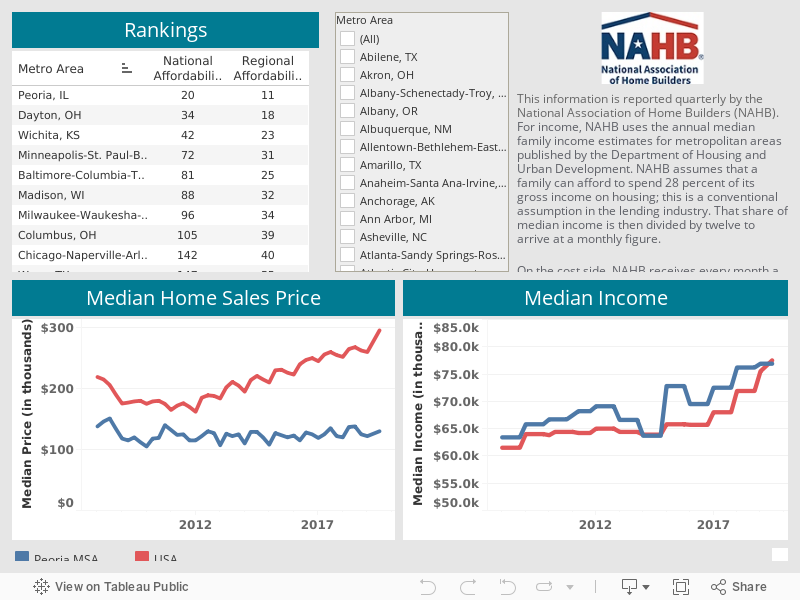
Housing Opportunity
The Housing Opportunity Index (HOI) uses two components (median income and housing prices) to determine the availability of housing to the average buyer in a given region. Greater Peoria offers a balance of high median income and low housing prices. Source: National Association of Home Builders.
Can’t find the data you are looking for? Submit a Data Request. We want to make sure this site has what you need to be a useful tool.